

Curves overview
You can use the Curves dialog box or Levels dialog box to adjust the entire tonal range of an image. The Curves dialog box lets you adjust up to 14 different points throughout an image’s tonal range (from shadows to highlights). The Levels dialog box has only three adjustments (white point, black point, gamma). You can also use the Curves dialog box to make precise adjustments to individual color channels in an image. You can save Curves dialog box settings as presets. See Save and reapply adjustment dialog box settings.
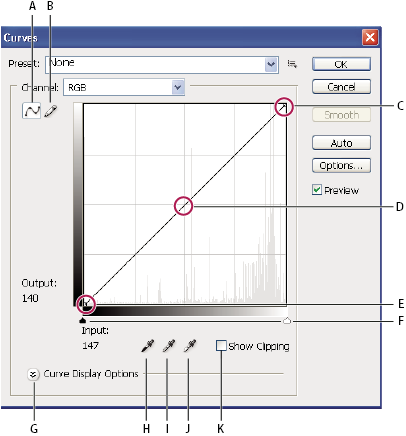
- A.
- Adjust curve by adding points.
- B.
- Draw a curve with the pencil.
- C.
- Highlights
- D.
- Midtones
- E.
- Shadows
- F.
- Black and white point sliders.
- G.
- Curve display options
- H.
- Set black point.
- I.
- Set gray point.
- J.
- Set white point.
- K.
- Show Clipping
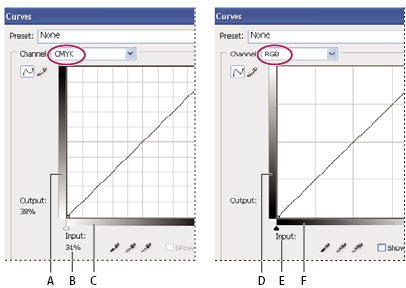
- A.
- Default orientation of CMYK tonal output bar
- B.
- CMYK Input and Output values in percentages
- C.
- Default orientation of CMYK tonal input bar
- D.
- Default orientation of RGB tonal output bar
- E.
- RGB Input and Output values in intensity levels
- F.
- Default orientation of RGB tonal input bar
 Set Curve display options
You can control the curve grid display using the Curve display options.
-
Do
one of the following:
-
Choose Image > Adjustments > Curves.
-
Choose Layer > New Adjustment Layer > Curves. Click OK in the New Layer dialog box.
-
- Expand the Curve Display Options and choose any of the
following:
-
To reverse the display of intensity values and percentages, choose Show Amount Of Light (0‑255) or Show Amount Of Pigment/Ink %. Curves displays the intensity values for RGB images in a range from 0 to 255, with black (0) at the bottom left corner. Percentages for CMYK images are displayed in a range from 0 to 100, with highlights (0%) at the bottom left corner. After the intensity values and percentages are reversed, 0 is at the bottom right corner for RGB images; 0% is at the bottom right corner for CMYK images.
-
To display gridlines in 25% increments, select Simple Grid; to display in 10% increments, choose Detailed Grid.
 To change the gridline increment, Alt-click (Windows)
or Option-click (Mac OS) the grid.
To change the gridline increment, Alt-click (Windows)
or Option-click (Mac OS) the grid. -
To display color channel curves superimposed on the composite curve, choose Show Channel Overlays.
-
To display a histogram overlay, choose Show Histogram. For more information on how to read a histogram, see About histograms.
-
To display a baseline drawn on the grid at a 45‑degree angle, choose Show Baseline.
-
To display horizontal and vertical lines to help you align points as you drag relative to the histogram or grid, choose Show Intersection Line.
-